Where to begin? Mick reveals why the County Record Office should be the first port of call for any project investigating the local landscape.
Maps, particularly early maps, are one of the most important sources for any local project similar to ours at Winscombe in Somerset. Most of these will be found in a County Record Office. Indeed, it is hardly worth embarking on such a project if it turns out there are not enough — or even any — early maps. It will make the work extremely difficult.
For very many parishes in this country, the earliest useful, detailed local map will be that compiled around 1840 by the tithe commissioners, and known as the ‘tithe map’. Following the Tithe Commutation Act of 1836, surveys of each parish were conducted to assess the value of land and hence the tithe paid on it. Incidentally, this also gives us landowners, tenants, land-use, acreage, and field names for each plot, and assessed value — a fantastic local source and the benchmark for starting any project. There is an ‘award’ or ‘apportionment’ with all this information, and usually a map. Frequently hand-drawn, coloured, and numbered, it is of paramount importance for any local project.
It is enormously advantageous if there is at least one large-scale map earlier than the tithe map. For Winscombe, the tithe map and award date to 1839-1840, but there is an earlier map of 1792. This was surveyed and drawn by William White for the Dean and Chapter of Wells Cathedral. He was a local surveyor who compiled many maps of Somerset, including at least 22 enclosure maps. White’s handiwork is very detailed in places, but there are gaps elsewhere. From other documents examined by Frances Neale and Maria Forbes, we know the field names, land-use, tenants (and leases — whether leasehold or copyhold), all related to the field numbers which occur on the map. The existence of these two maps enables us to compare lots of information over a 50-year period, providing a springboard to jump back to earlier documentary references without any supporting maps.
There are a few other early maps for Winscombe, or parts of the parish. In 1797 an Enclosure Act was passed in Parliament to enable the enclosure of the parish’s upland commons — Sandford Hill, Winscombe Hill (or Wavering Down), Sidcot Hill, and Winterhead Hill. The 1799 map shows the intended field and drove-road arrangements; it can also be readily compared with the 1792 and 1840 maps to reveal the before and after situation. In addition, this map gives a number of road and lane names associated with small areas of common and waste that were to be enclosed. These names are important, as we shall see in a later column. There is also a drainage map for the neighbouring parish of Congresbury which shows much of the northern (Sandford) end of the parish in 1828.
It cannot be assumed that we have tracked down all the early maps available for our area of study. A map of the northern part of Shapwick village, dated to 1811, turned up in private possession long after the project had started. Shortly before the Winscombe Project began, an old map of Woodborough Green was found. This shows the large triangular green in the middle of the parish with a few farms around it. A series of lead mine-shafts are shown along one side of it. The map turned up with many other documents in the roof space of a house in Wells, which may have formerly been the Chancellor’s house. By happy chance, because the people living in the house at the time, Nick and Chris Bristow, had lived in Winscombe, they recognised that the ‘Woodborough Green’ written on the map referred to the area now known as Winscombe.
For later maps we largely rely on the Ordnance Survey 25” (to the mile, now 1:2,500) and 6” (to the mile, now 1:10,000) maps. The first edition of these maps, produced around the 1880s, is the finest set of maps the Ordnance Survey have ever produced, and are far superior in detail to the computer-drawn monstrosities of today. The detail is superb, with buildings and lanes shown to scale, and even individual trees marked. I prefer to use these maps as the basis for all my mapping carried out on any project. There are second editions (around 1903), and later editions from the 1930s and 1950s. For Winscombe, the last full survey maps available, and the most up to date, are from the 1970s. These have to provide the base for fieldwork and any attempts at mapping earlier features. So, once you have gathered the available maps, what can they tell you?
Map regression
One of the main reasons for all this interest in the availability, scale, and detail of the maps, and what information comes with them, is because they are essential for any map regression exercises. The idea of map regression is to identify changes that have taken place, in field boundaries and alignments, road and path patterns, and building sites. It is only when comparing one map closely with another that such subtle changes can be picked out.


Over the years I have built up a series of parish maps, to the same scale, by transcribing one map’s details onto another. Back in 1995/1996 I did this for Winscombe, long before there was any intention of carrying out a project. I produced a series of 1:10,000 parish maps from the current Ordnance Survey map, with all the housing estates, and then worked back through the early 20th century and late 19th century. I finished by creating a late 18th-century map, based on the 1792 and 1799 surveys.
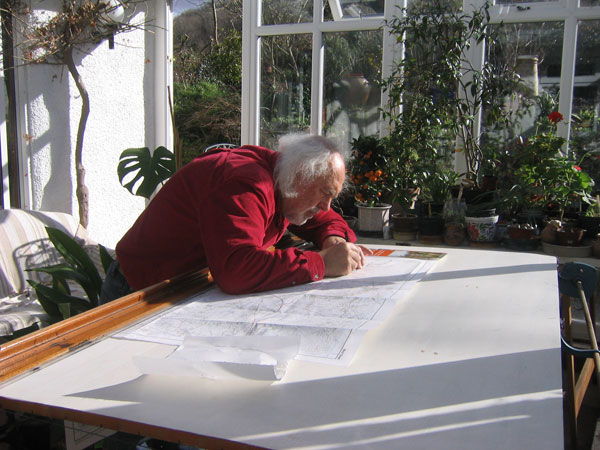
These were produced as follows: starting with a tracing of the latest map (1970s), I placed another sheet of tracing paper over this and, using its immediate predecessor (the 1950s map), transferred the details. Firstly, I put on all the boundaries that are still in situ; allowing any changes to be easily spotted and transcribed. These can be done in red to highlight the differences. The process is then repeated going backwards in time through all the maps, transferring the evidence of each earlier map onto the tracing of its immediate successor. I always do this exercise manually with tracing paper and pens, accompanied by a glass of Cabernet Sauvignon. Nowadays it can be done with computer programmes, and my colleagues and fellow project-members Phil and Maddy Knibb will explain this next time.
Personally, I think there is a problem with using computers to do this type of work. A good analogy is recording a scene with a camera rather than doing a painting or drawing of it. In a matter of a fraction of a second, the camera can record the scene without the photographer processing any of the information. With a painting or drawing, however, the scene has to be closely analysed and understood if the picture is to be a true likeness.
And so too with map production. Laboriously copying maps by hand and gradually appreciating the changes in the landscape from one map to another really enables the detail to be understood. Even if a field boundary is not depicted entirely accurately, you can often see what was intended. Time and again it is as if we can get into the surveyor’s head and appreciate the landscape as he saw it. Nevertheless, most people will probably opt for the speed of computer-assisted drawing of maps. I just hope they do not miss the detail of the original maps.
Further Reading:
M Aston (1985) Interpreting the Landscape: landscape archaeology in local studies, London: Batsford, especially p. 18.
J P Kain and H C Prince (1985) The Tithe Surveys of England and Wales, Cambridge University Press.
R J P Kain and R R Oliver (1995) The Tithe Maps of England and Wales: a cartographic analysis and county-by-county catalogue, Cambridge University Press.
This article was originally published in issue 278 of Current Archaeology magazine.